Four Quarter 2024
Quarterly Comments December 31, 2024
Against a backdrop of stronger than anticipated economic growth and moderating inflation, U.S. equity indices delivered a second consecutive year of strong returns in 2024 with the S&P 500 gaining 25%, the Dow up 15%, and the NASDAQ rising 30%. The equal weighted version of the S&P 500 gained 13%, putting into stark relief the importance of the Magnificent Seven (M7) technology companies to U.S. equity market performance. Though there was a fair amount of interest rate volatility, investment grade, intermediate duration bond portfolios delivered low single digit returns as coupon income offset intermediate term interest rates drifting higher.
The economy: inflation, interest rates, and the U.S. consumer
The Federal Reserve cut interest rates by 25 basis points (bps) at its November and December meetings, bringing the total reduction in the Federal Funds rate to 100 bps since it began its widely anticipated monetary policy easing cycle in September 2024. In contrast to many past monetary policy cycles, this round of easing comes not in response to broad-based weakness in the economy, but rather as a recalibration of policy permitted by the continued moderation of inflation and in response to a modest uptick in the unemployment rate.
Despite slightly higher unemployment, the consumer has continued to power the U.S. economy as wage growth has outpaced inflation and wealth effects from gains in equity markets and rising home values have helped to mitigate pressure from inflation and higher interest rates. That said, looking underneath the headline figures consumption from lower income households has slowed significantly and higher income households have been “trading down” both in terms of where they shop and the composition of their baskets of goods purchased.
U.S. unit-labor productivity has grown at more than 2% for the past five quarters driven by accelerated technology adoption and opportunities for career advancement for workers related to pandemic era supply chain and labor market disruptions. For context, labor productivity grew at greater than 2% in only two quarters in the five years leading up to the pandemic. It is important to recognize that the unemployment rate is a backward-looking indicator and that other, more forward-looking labor market indicators do suggest that, particularly for white collar jobs, the labor market has cooled meaningfully from its pandemic peak. The average time to find a new position has increased to approximately six months from about five months and the ratio of job openings to unemployed workers is nearing one to one. Thus far companies have taken advantage of the boost in productivity rather than layoffs to manage costs but given the dependence of the economy on consumption this is a risk we will be monitoring closely.
Where inflation, and thus interest rates, goes from here will have a significant influence on the economy going forward. Fed communications and market pricing both seem to indicate that the “last mile” of the journey to the 2% inflation target is likely going to be the most difficult, and markets are indicating that interest rate cuts will be more modest in scope and implemented over a longer period of time than was expected six to twelve months ago.
Equities
Building on the momentum of Q4 2023, the S&P 500 came out of the gate strongly in 2024. It gained 10% by the end of March and, with the exception of an ~8.5% drawdown between mid-July and early August related to a partial unwinding of leveraged Japanese yen carry trades, never experienced anything close to a -10% “correction” that typically occurs at least once a year. Much as in 2023, the S&P 500’s performance in 2024 was dominated by the M7 mega cap technology stocks (AAPL, AMZN, GOOG, META, MSFT, NVDA, TSLA) which now represent ~35% of the S&P 500’s market capitalization, up six percentage points from the end of 2023. The three largest members of the S&P 500 (AAPL, MSFT, NVDA) represent ~20% of the index’s market capitalization which is very concentrated relative to history. Near prior peaks in 1983 (IBM, T, XOM), 1999 (MSFT, GE, CSCO) and 2008 (XOM,WMT, PG) the top three holdings represented 13%, 12%, and 10% respectively.
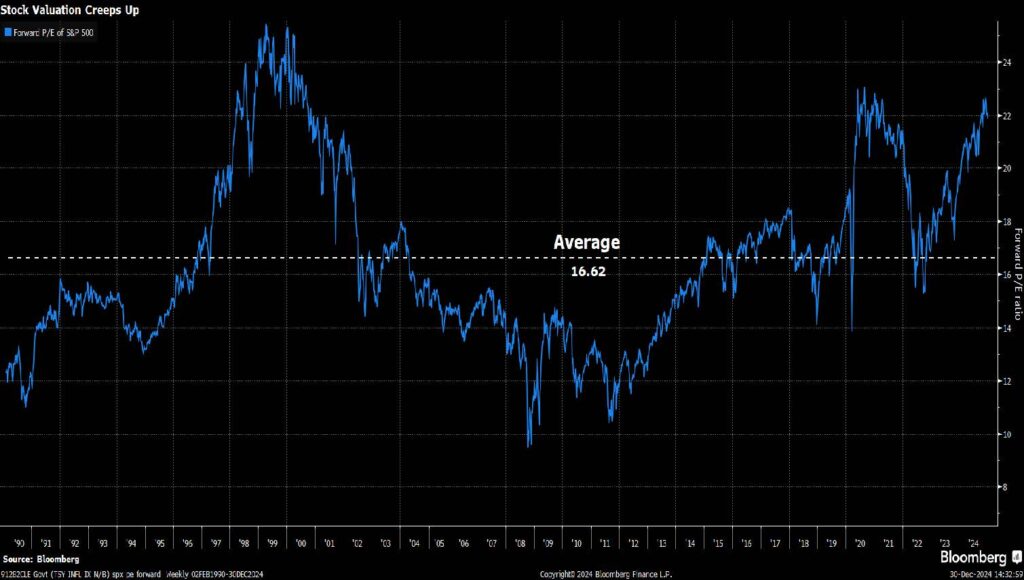
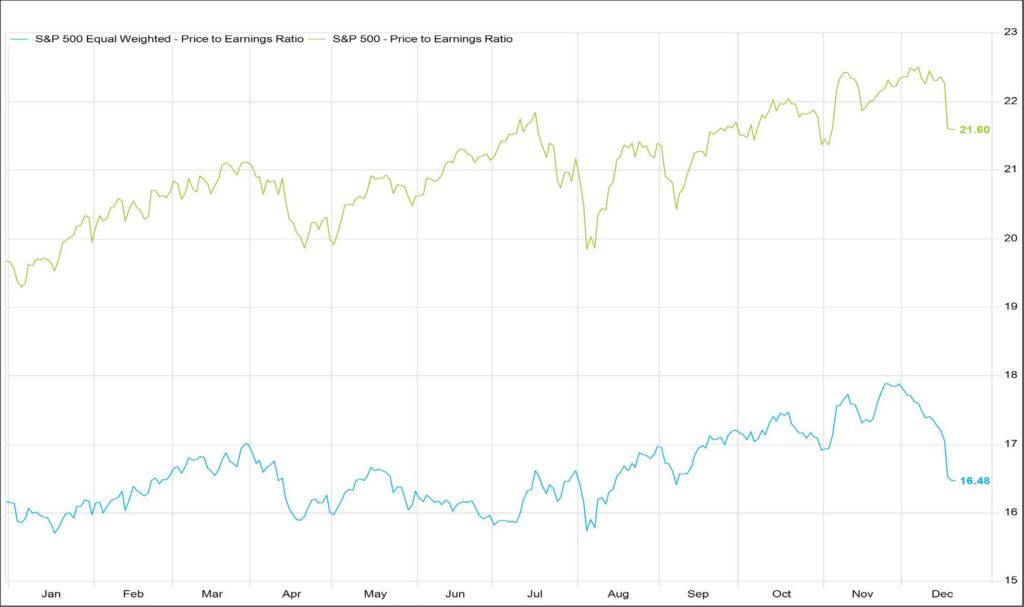
Looking forward, the S&P 500 is currently trading for ~21.6x 2025 earnings which are expected to grow ~14% year over year. This is stretched relative to the long-run average of ~17-18x. As a group the M7 currently trades for ~43x forecasted 2025 earnings which are projected to grow ~30% year over year. In contrast to its capitalization weighted counterpart the equal weight S&P 500 trades for ~16.5x estimated 2025 earnings, assuming ~12% year over year earnings growth. This compares favorably to an average of ~17x over the preceding decade.
The M7 have been key drivers of U.S. equity market performance over the past two years, and in many respects have earned the valuation premium that they command. However, their current valuation and consensus growth estimates leave a relatively smaller margin of safety given the lofty expectations. Against the backdrop of a still strong U.S. consumer and economy we continue to seek opportunities to take positions in companies that participate in areas of the economy that have secular tailwinds and that meet our criteria for balance sheet strength, free cash flow generation, competitive moats, and contextually reasonable valuations.
Fixed Income
Many fixed income investors entered 2024 with high hopes for aggressive monetary policy easing. Inflation seemed to be on a glide path to the Fed’s 2% target, labor market conditions were loosening, and unemployment, while still quite low, had moved up enough to put the full employment side of the Fed’s dual mandate back on the table. The Fed cut interest rates by 100 bps between September and the end of the year, falling well short of expectations at the beginning of the year. The monetary policy sensitive two-year Treasury note was quite volatile as market expectations shifted, peaking in late April at just over 5% and hitting a trough of 3.54% in mid-September. The two-year finished 2024 at 4.24%, just one basis point below where it began the year, and up 62 basis points from the date of the Fed’s first rate cut. Further out the yield curve, the ten-year Treasury bond also had a volatile year. Starting the year at 3.88%, ten-year yields peaked in late April at 4.71% and then rallied to 3.62% ahead of the September Fed meeting before selling off to end the year at 4.56%.
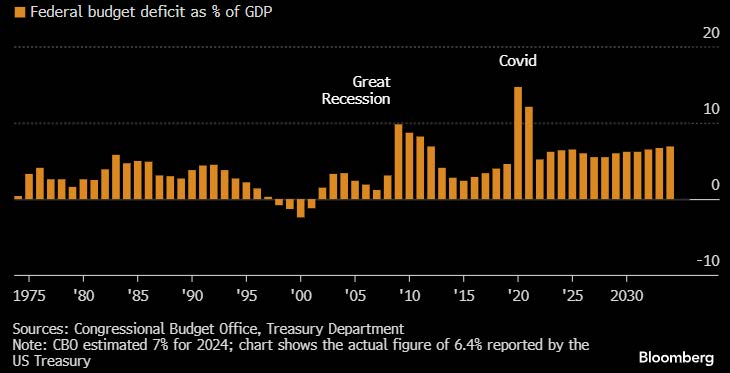
Beyond the volatility in benchmark bond yields, there are three bond market indicators that warrant close attention. First, is the shape of the yield curve. After being inverted (two-year yields above ten-year yields) since July 2022, the yield curve finally dis-inverted in September 2024. An inverted yield curve has historically been an indicator of economic trouble on the horizon, with the dis-inversion of the yield curve being a reasonably reliable timing indicator. Thus far the economy has remained robust, but we hesitate to say that this time is different. Second, credit spreads, or what borrowers pay above benchmark Treasury rates to borrow in bond markets, are historically tight for both investment grade and high yield bonds. On one hand, tight credit spreads are an encouraging sign for risk assets, as they indicate that companies can access capital on relatively attractive terms, which supports growth. On the other hand, in the context of a dis-inverting yield curve and signs of a somewhat less robust labor market it could indicate a degree of complacency. The third metric that bears watching is the term premium, a.k.a. the incremental yield that investors demand for lending further out the yield curve. With the increase in longer term Treasury yields in the fourth quarter of 2024, the term premium has moved up. From a glass half full perspective this can be seen as an indicator that future economic growth is going to be robust. From a glass half empty perspective, it could be read as an early indicator that renewed inflationary pressure is building or that the U.S. fiscal position, with a large budget deficit and growing debt load, is awakening the long left for dead bond vigilantes.
The move up in interest rates in the fourth quarter has made fixed income relatively more attractive for yield focused investors than it was in the late summer and early fall. High quality corporate and taxable municipal bonds are currently offering yields in the mid-4% to mid-5% range depending on maturity, while high quality tax-free municipals are currently carrying taxable equivalent yields in the mid-4% to mid-5% range. We continue to deploy our strategy of building laddered bond portfolios with final maturities of approximately 10 years and overall duration of 5-6 years, though the profile of individual portfolios can be tailored to meet specific client objectives. We have been adding to portfolios across the maturity spectrum, which allows investors to capture currently available yields while also being reasonably well hedged against interest rate risk. If rates move higher from here, bonds maturing in the near term can be reinvested at higher rates. Conversely, if rates come down investors have locked in reasonably attractive yields on high quality credits.
Summary
Against a backdrop of a stronger than expected economy and moderating inflation, equity investors enjoyed a second consecutive year of strong returns in 2024. Performance of the S&P 500 was once again driven by the M7 technology stocks. These seven stocks represent ~35% of the S&P 500’s market capitalization which is exceptionally concentrated relative to history. With valuations for the S&P 500 and its largest constituents stretched, we seek to add positions in companies that have secular economic tailwinds, meet our quality criteria, and have reasonable valuations. For yield and safety focused investors investment grade bond markets currently offer reasonably attractive yields on an absolute basis, though spreads are tight. We continue to monitor conditions in the labor and bond markets to gauge the health of the consumer and the broader economy. Asset allocation and portfolio construction are driven by each client’s specific time horizon, investment goals, liquidity needs, and risk tolerance. We welcome the opportunity to meet with clients to make sure these variables are aligned.
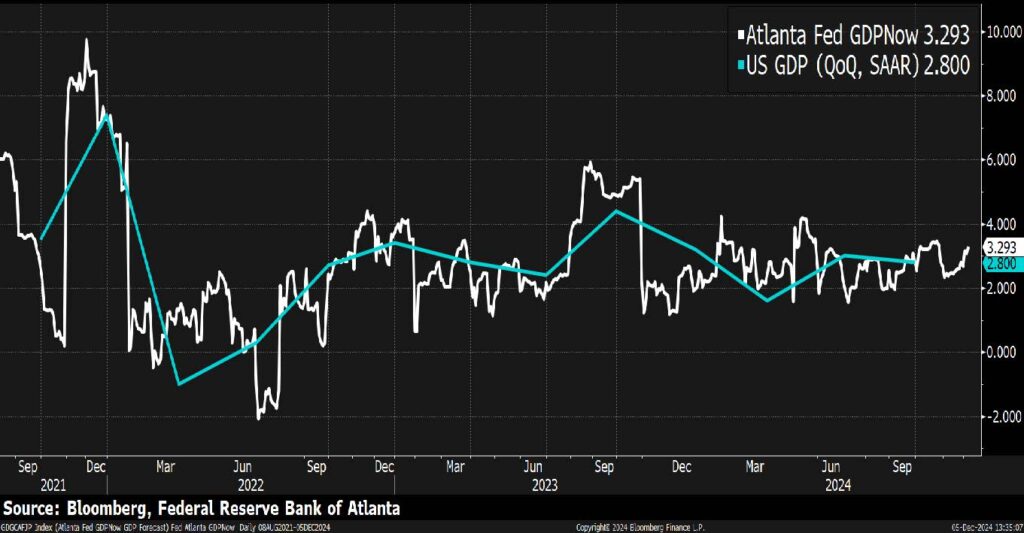
U.S. GDP: Continued strong growth despite recession worries
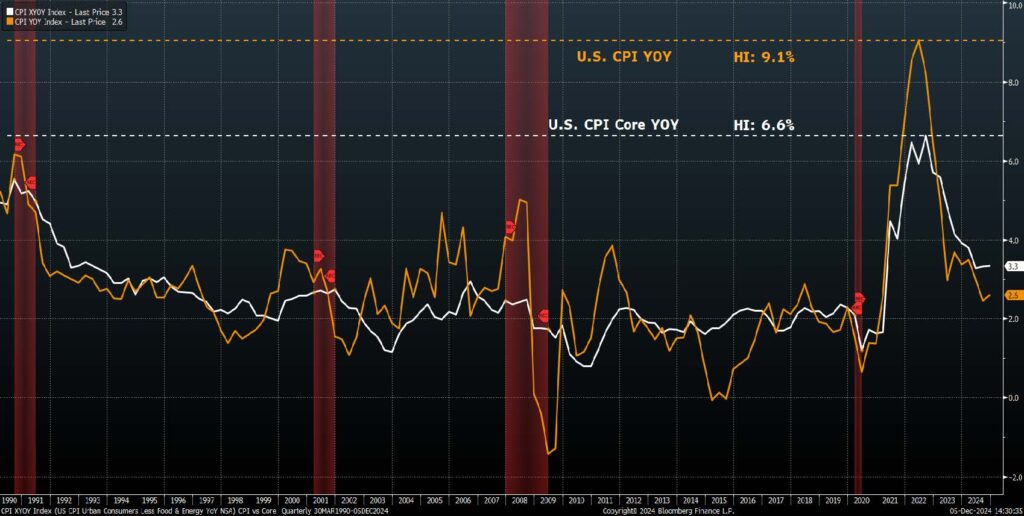
Inflation peaked just above 9%: Still not at Fed 2% PCE target
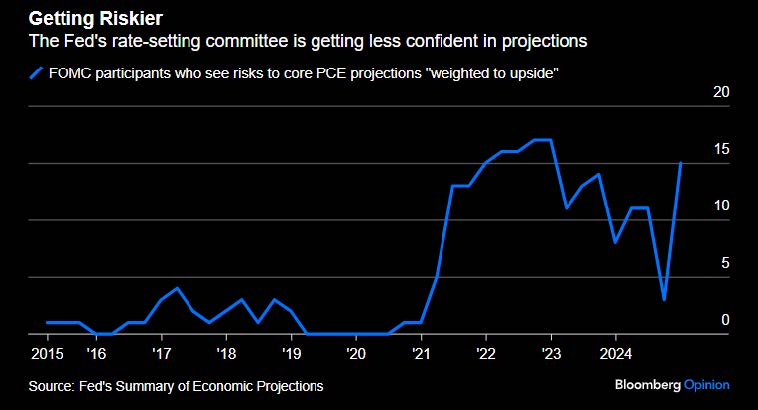
The Fed is becoming less confident
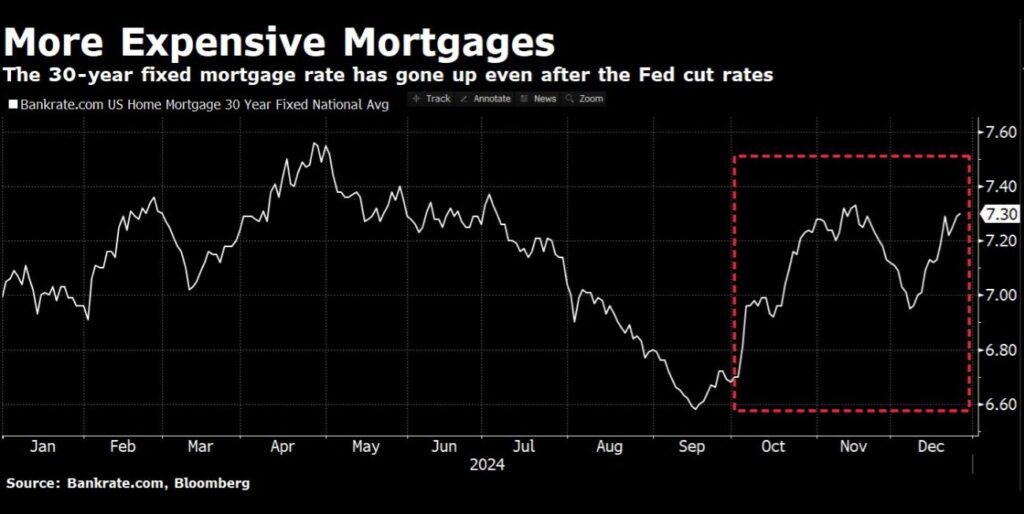
Mortgage rates rise: A headwind for housing and residential construction
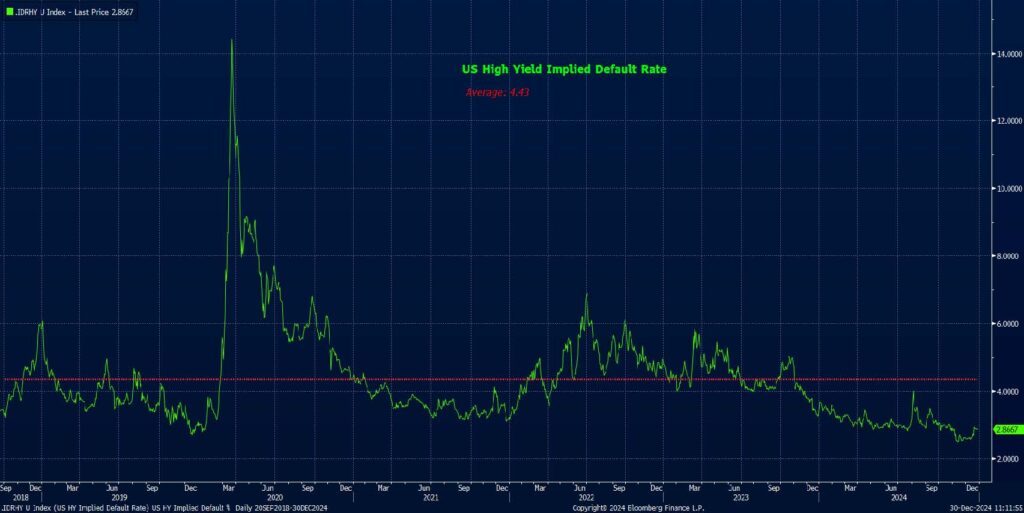
A positive: U.S. High Yield default rate well below the long-term average
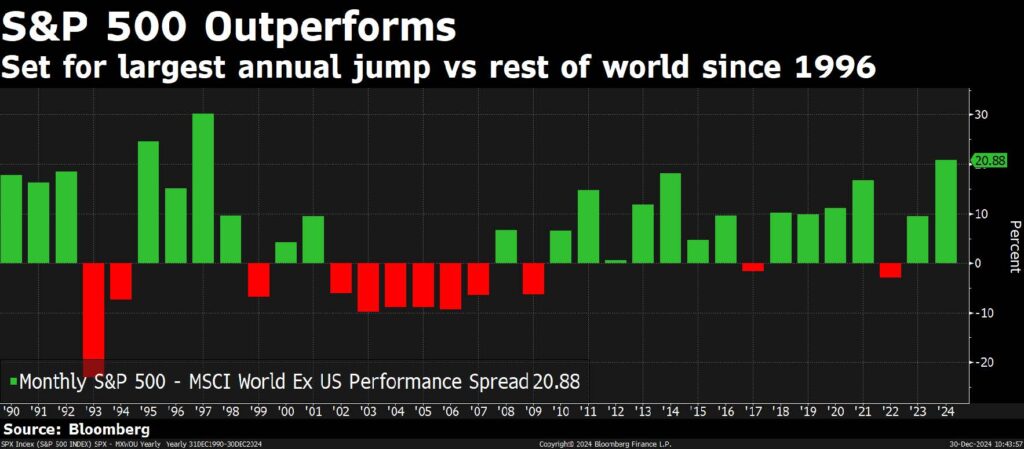
S&P 500 Index experienced greatest outperformance vs world in over 27 years
SPX Forward P/E: Market is expensive
S&P 500 vs equal weight P/E ratio: Equal weight removes distortions of Mag 7
The Federal budget as a % of GDP: Interest on debt over $1 trillion annually