Summary
The second quarter of 2025 brought investors a steady stream of headlines, including the imposition and subsequent pause of “Liberation Day” tariffs, threats to the independence of the Federal Reserve, and a war between Israel and Iran with U.S. involvement. Despite the turmoil, the economy remained resilient with moderating inflation and low unemployment. With tariff-related inflation uncertainty, the Federal Reserve held its benchmark rate steady. Equity markets overcame volatility as corporate earnings broadly surpassed expectations. Fixed income markets saw the Treasury yield curve steepen amid concerns of long-term deficits and debt levels. In this quarter’s Market Comments, we examine the economy and capital markets.
The Economy
Economic data released over the quarter presented a nuanced picture of a slowing but resilient U.S. economy. Real gross domestic product (inflation-adjusted GDP) for the first quarter of 2025 was revised downward to a -0.5% annualized rate. As a reminder, the contraction was driven in part by a significant pull-forward of imports spurred by concerns over potential price increases from anticipated tariffs. This drag on net exports masked otherwise stable underlying demand. The Atlanta Fed’s GDPNow model estimates second quarter real GDP growth of 2.9% as of June 27th. This projection reflects continued labor market strength, real wage gains, and gradual disinflation, even as elevated interest rates weigh on certain segments of the economy. The expected rebound may also reflect demand pull-forward effects related to stockpiling during the current 90-day tariff pause.
Critical to a consumption-based economy, the labor market remained strong. Nonfarm payrolls increased by an average of 143,000 jobs per month in April and May. The unemployment rate edged slightly higher to 4.2% in June, remaining near historically low levels, while labor force participation held steady averaging 62.5%. Nonsupervisory wage growth in April and May was 4.0% and 4.1%, respectively, accelerating from 3.4% and 3.8% in 2024. Notably, the U.S. labor force has now experienced real wage growth (where wage increases outpace inflation) for twenty-five consecutive months, reinforcing consumer purchasing power despite economic headwinds.
Inflation trended lower but remained above the Federal Reserve’s 2% target. The Personal Consumption Expenditures (PCE) Price Index rose 2.3% year-over-year in May. Core PCE, which excludes volatile food and energy prices and is the Fed’s preferred inflation gauge, increased 2.7% from May 2024 (flat with March). Services inflation, particularly housing, proved sticky, contributing to the higher monthly reading. Housing remains historically unaffordable, as elevated home prices and mortgage rates dampen demand. While there is no clear catalyst for a broad correction, there are concerns for a potential housing market reset reminiscent of the 2005–2011 cycle if macroeconomic conditions deteriorate or credit availability tightens.
Consumer sentiment troughed in April and May coinciding with peak tariff fears,andimproved in June as fears abated with resilient economic data. Total retail sales slowed to 3% in May from average monthly growth of 4.5% from January through April highlighting consumer fatigue and potentially a reversal of tariff-influenced pull-forward demand in autos and other tariff-impacted goods. Manufacturing activity remained subdued, with the May ISM Manufacturing PMI at 48.5%, the fourth consecutive decline in the index. Services activity declined similarly, with May’s reading at 49.9% crossing into contraction territory for the first time since mid-2024.
While the economy appears healthy, we are monitoring potential cracks, including lower second half earnings growth rates from pull-forward demand, rising unemployment rates, tariff-induced inflation, and a deteriorating housing market. We keep in mind that the current Administration’s goal is to approve the Congressionally approved tax bill before the July 4th recess, and the 90-day tariff pause is set to expire on July 8th. Both are catalysts that could drive markets in either direction.
Equity Markets
U.S. equity markets posted mixed but positive returns in the second quarter, supported by better-than-expected corporate earnings and continued optimism surrounding artificial intelligence. In the second quarter the S&P 500 advanced 10.9%, the equal-weight S&P 500 grew 5.5%, the Nasdaq rose 18.0%, and the Dow gained 5.5%. Year-to-date these indices have gained 6.2%, 4.8%, 5.9%, and 4.5%, respectively.
Volatility, as measured by the CBOE Volatility Index (VIX), experienced a sharp spike in early April following the initial announcement of tariffs, reflecting heightened investor uncertainty. The S&P fell nearly 20% from its February highs, while the Nasdaq plunged 23.9% into bear market territory. This was followed by a historically rapid reversal when tariffs were paused. The S&P gained 20% in two months from the April lows, a feat only achieved five other times since 1950. The recovery was also the fastest rebound to the prior closing high after a decline of at least 15% (89 days). Amidst the ongoing U.S. market uncertainty, investors have increasingly favored international stocks leading to the outperformance of the MSCI All Country World Index ex-U.S. through June.
The S&P 500’s valuation remained elevated at 22.1x forward earnings at quarter-end 1.8x and 3.4x higher than its respective 5 and 10-year averages, while the equal-weighted index traded at 16.9x, in-line with its 5 and 10-year averages. Market breadth narrowed through the quarter, reflecting a move to secular technology growth themes. Concentration in the Magnificent Seven technology companies (NVDA, MSFT, AAPL, AMZN, GOOG, META, TSLA) remains high at 31.0% weight in the S&P 500, whose average forward earnings multiple is 43.2x (28.3x excluding TSLA).
These seven companies have a common theme: leverage to AI. The technology industry has been defined by waves of innovation, including networking in the 1990s, desktop and mobile internet in 2000’s and 2010’s, and cloud/software-as-a-service (SaaS) in 2015-today. The AI theme emerged in late 2022 with ChatGPT’s public release and has the potential to be another mega wave for technology. Thus far, semiconductors/hardware have been the primary beneficiaries (Nvidia, Broadcom, Taiwan Semiconductor), with access/compute providers (Amazon, Google, Microsoft, Oracle) and model developers (OpenAI, Google, Anthropic) also experiencing robust growth. On Microsoft’s latest earnings call, CEO Satya Nadella highlighted the company’s rising AI demand, having processed 100 trillion tokens in the quarter (equivalent to 150 billion pages of text in this letter’s format), up five times from the prior quarter with 50 trillion of those tokens generated in March alone. This illustrates how significant demand is even with AI’s limited adoption, and it also highlights the continued opportunities in power/related infrastructure (Vistra, Quanta) and software/AI agents (Microsoft) as compute capacity is built to meet growing demand and use cases.
Given the excitement around AI, it is important to remember that the beginning of major technology cycles are followed by extended periods of development and adoption. For example, the cloud/SaaS wave began in the wake of the Great Financial Crisis in 2009-10 and Gartner estimates this spending will represent over half of global software budgets in 2025. Beneficiaries of this wave including Microsoft, Amazon, and Netflix have generated annualized returns of 20.4%, 25.2%, and 39.3%, respectively, since December 2009. We are less than three years into the AI cycle, and there is reason to believe there is a long way to go. Capital markets are currently pricing in this optimism, and history has proven that even the secular winners noted above have experienced multiple significant corrections over that period.
We remain disciplined in this expensive market, adhering to our proven investment strategy that focuses on high quality companies with strong balance sheets, competitive moats, recurring revenues and cash flows, and excellent management teams. We are being patient with entry prices, are managing position sizes, and have a willingness to hold cash (money market yields are 4.1%) when risks outweigh future returns.
Fixed Income Markets
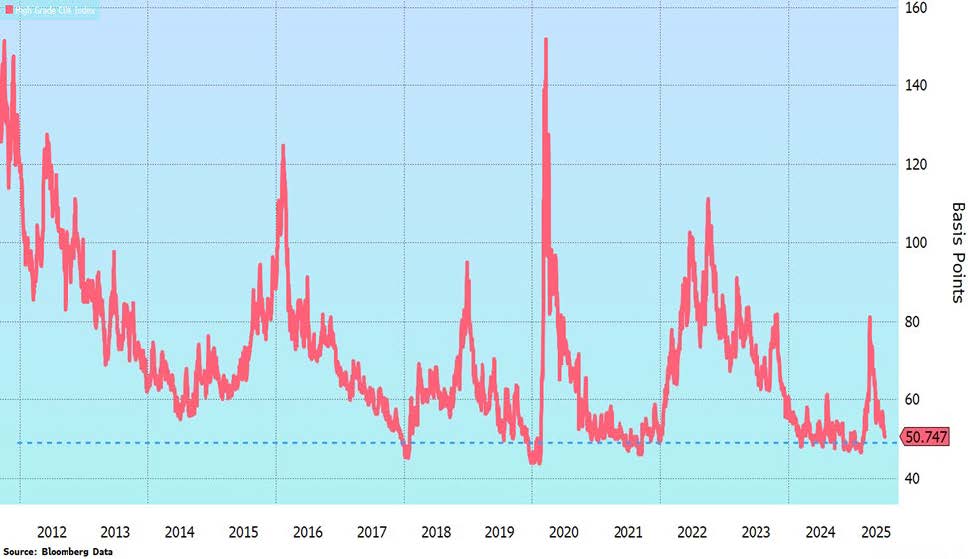
Credit markets did not escape the second quarter volatility as spreads widened in early April from the tariff announcements and fears of Chairman Powell’s removal and tightened as fears were allayed. Overall, Treasury yields modestly steepened in the quarter as investor expectations increasingly aligned with the Federal Reserve’s rate cut expectations. The rate-sensitive 2-year yield fell from 3.89% to 3.72%, while the benchmark 10-year Treasury yield ended the quarter up two basis points at 4.23%, oscillating between 3.99% and 4.60%.
The Federal Reserve held the federal funds rate steady at a target range of 4.25% to 4.50%. In its June policy meeting, the Federal Open Market Committee (FOMC) signaled that one or two rate cuts could be appropriate before year-end, contingent on further progress in inflation and a continued healthy labor market. The Fed remains in a wait-and-see mode, monitoring the impact of higher tariffs on prices and economic activity. Interestingly, the Fed is now only forecasting one rate cut in 2026, down from two in the May meeting, while futures markets are currently expecting three. Given tight current credit spreads, low corporate default risk, and healthy economic data, it appears the market is pricing in a soft landing for the economy. This variance in expectations may also be attributable to current expectations of a more dovish Chairperson appointment next May when Chairman Powell’s term ends. This may rekindle Federal Reserve independence concerns, undermining the value and credibility of the U.S. dollar, and leading to structurally higher interest rates.
Fixed income is an attractive option for investors looking for ballast, income, and liquidity in uncertain economic times. We continue to deploy our strategy of building laddered bond portfolios with final maturities of approximately 10 years and overall duration of 5-6 years, though the profile of individual portfolios can be tailored to meet specific client objectives. This approach gives us flexibility to reinvest maturing notes where we see the best opportunities in uncertain times. We have observed interesting opportunities in the municipal bond market, with high-quality bonds offering attractive tax-adjusted yields for high tax bracket investors.
Conclusion
The second quarter of 2025 was highly volatile and marked by a series of headline events that historically would have resulted in market drawdowns. Despite this, markets shrugged off geopolitical and domestic uncertainties, underscoring investors’ optimism and focus on economic resilience, corporate fundamentals, and the potential for a soft landing. While data on inflation, employment, and corporate earnings were positive, this data is backwards looking and many risks remain as we move into the second half of the year (tariffs/inflation, valuations, government deficits). We continue to emphasize diversification and quality across all asset classes, seeking opportunities that align with clients’ long-term financial objectives and risk tolerance.
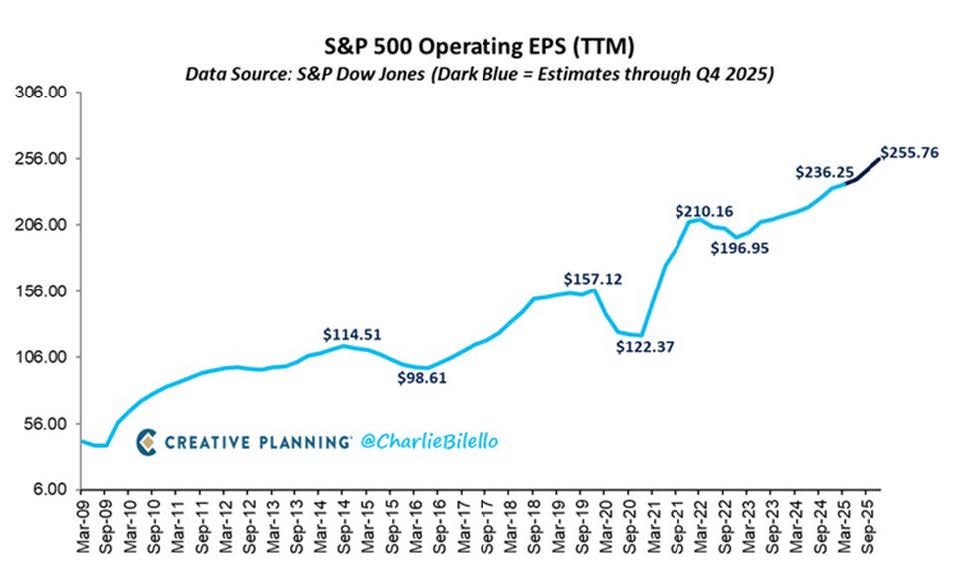
S&P 500 earnings forecasted to increase 8.5% in 2025
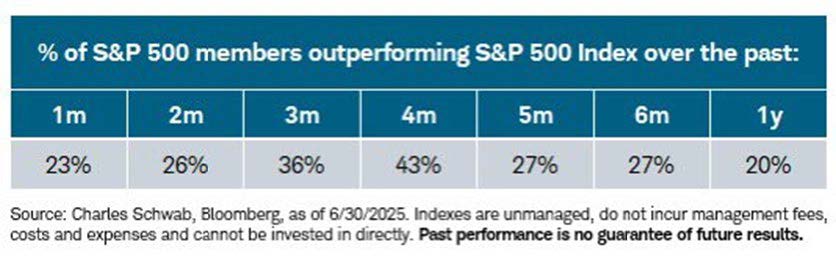
A narrow equity market
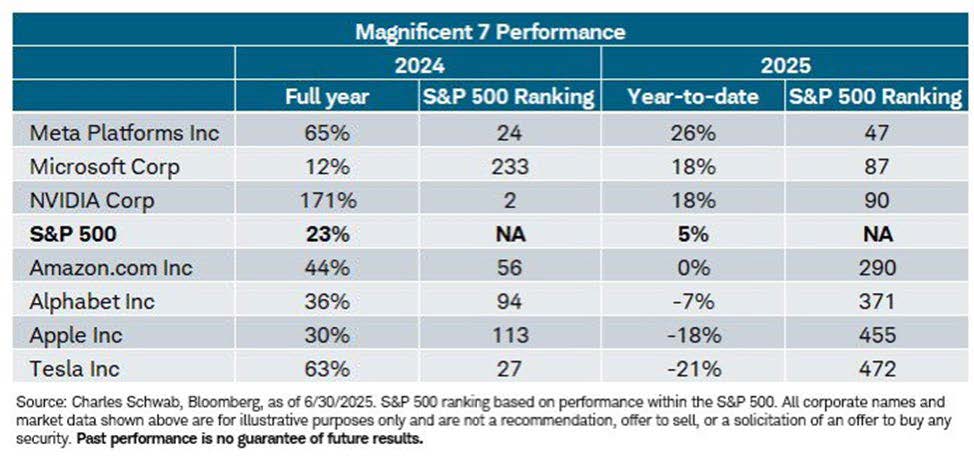
Some of last year’s high-flyers take a break
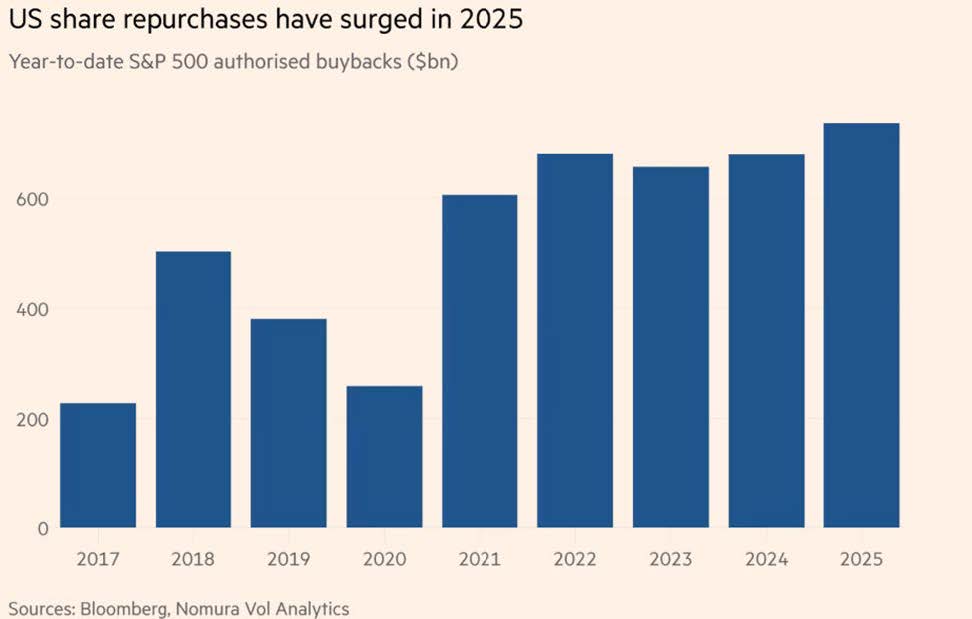
Despite tariff uncertainty, companies have ramped up their share repurchases
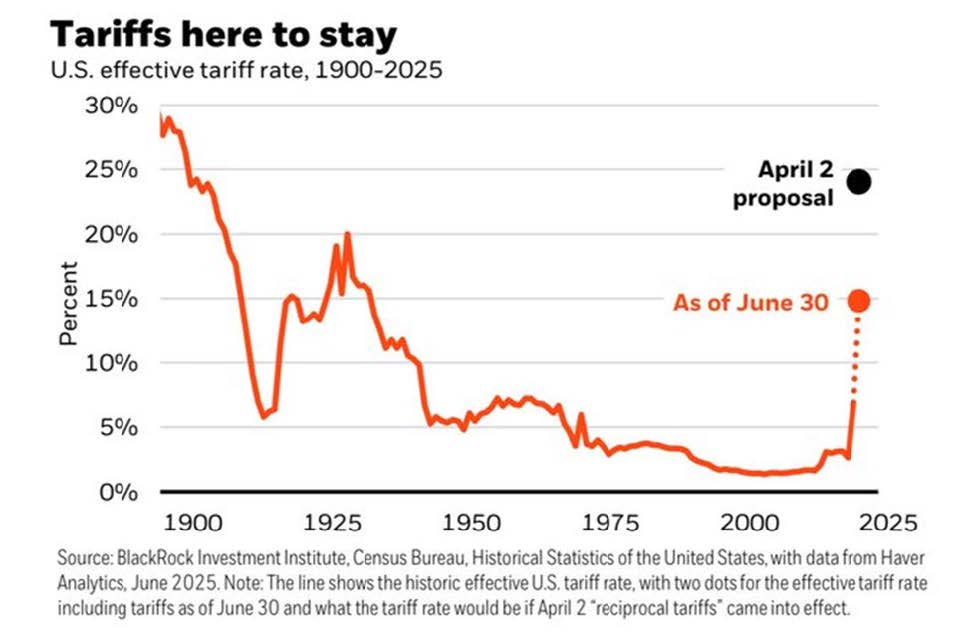
Tariff impact to economy and company earnings still unclear
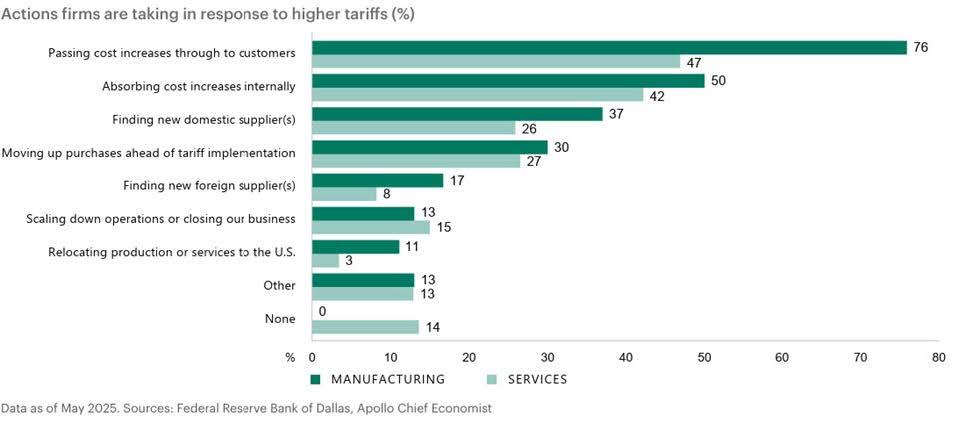
Suggests inflation could remain sticky
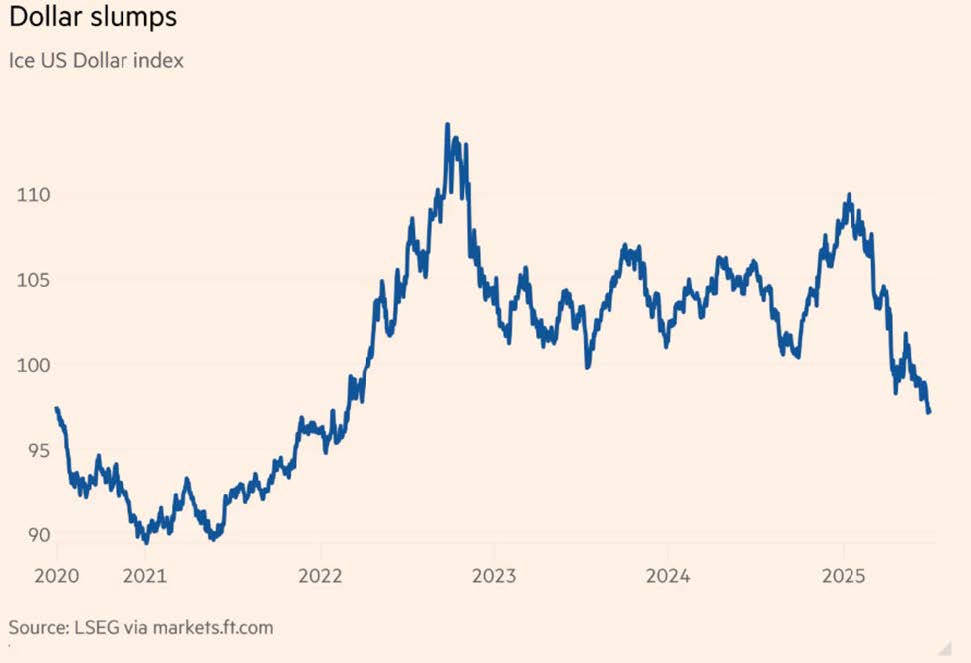
A weak dollar makes imported goods and services more expensive
Investment grade bond yield spread over Treasuries is tight, signaling low economic stress