Equity markets were mixed in the second quarter. The S&P 500 (SPX) returned 4.3% and the NASDAQ rose 8.5%, while the S&P 500 Equal Weight Index (SPW), the Dow, and Russell 2000 experienced losses of -2.6%, -1.3% and -3.3%, respectively. This varied performance was driven by a resilient economy, a sustained focus on artificial intelligence, and increased concentration in the largest technology companies. Bonds were volatile during the quarter, with yields on the 10-Year U.S. Treasury initially rising to 4.7% in April and reverting to 4.4% at quarter end, up 20bps compared to the first quarter. In this quarter’s Market Comments, we cover mixed signals from economic indicators, an increasingly concentrated equity market, and fixed income’s role in a diversified portfolio.
Economy
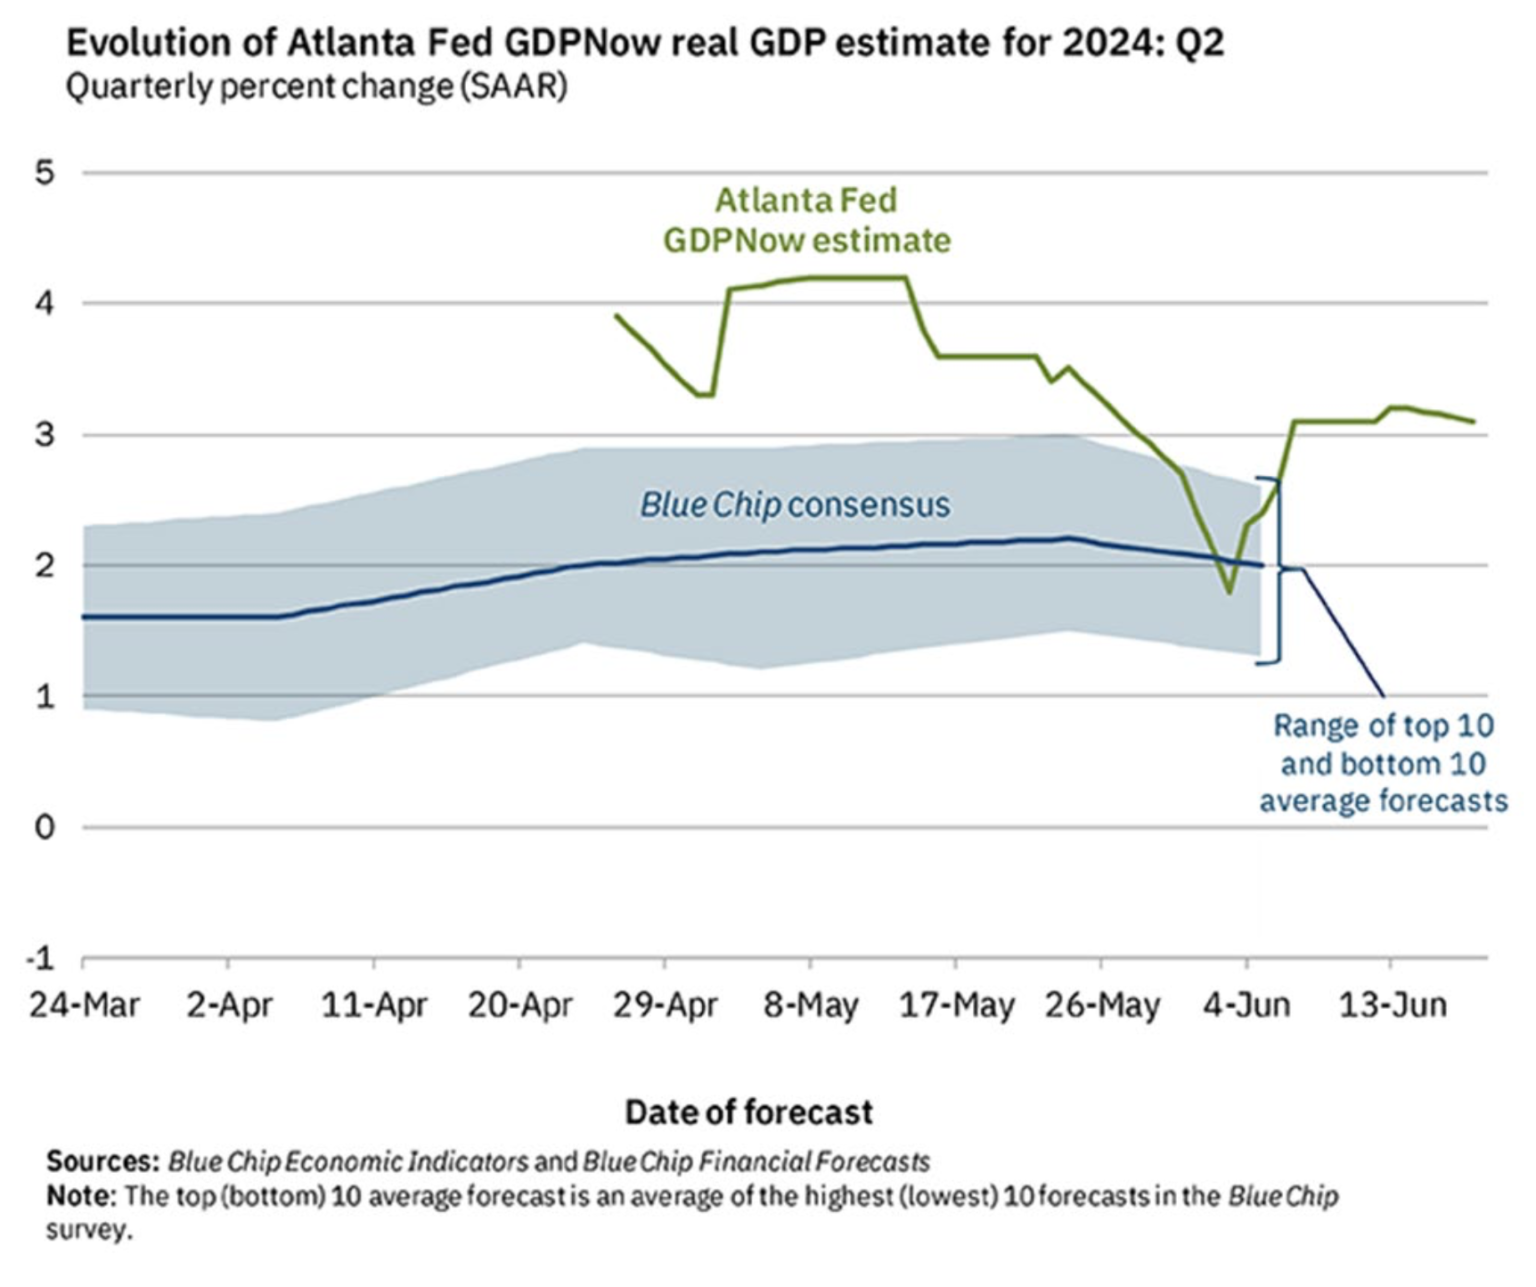
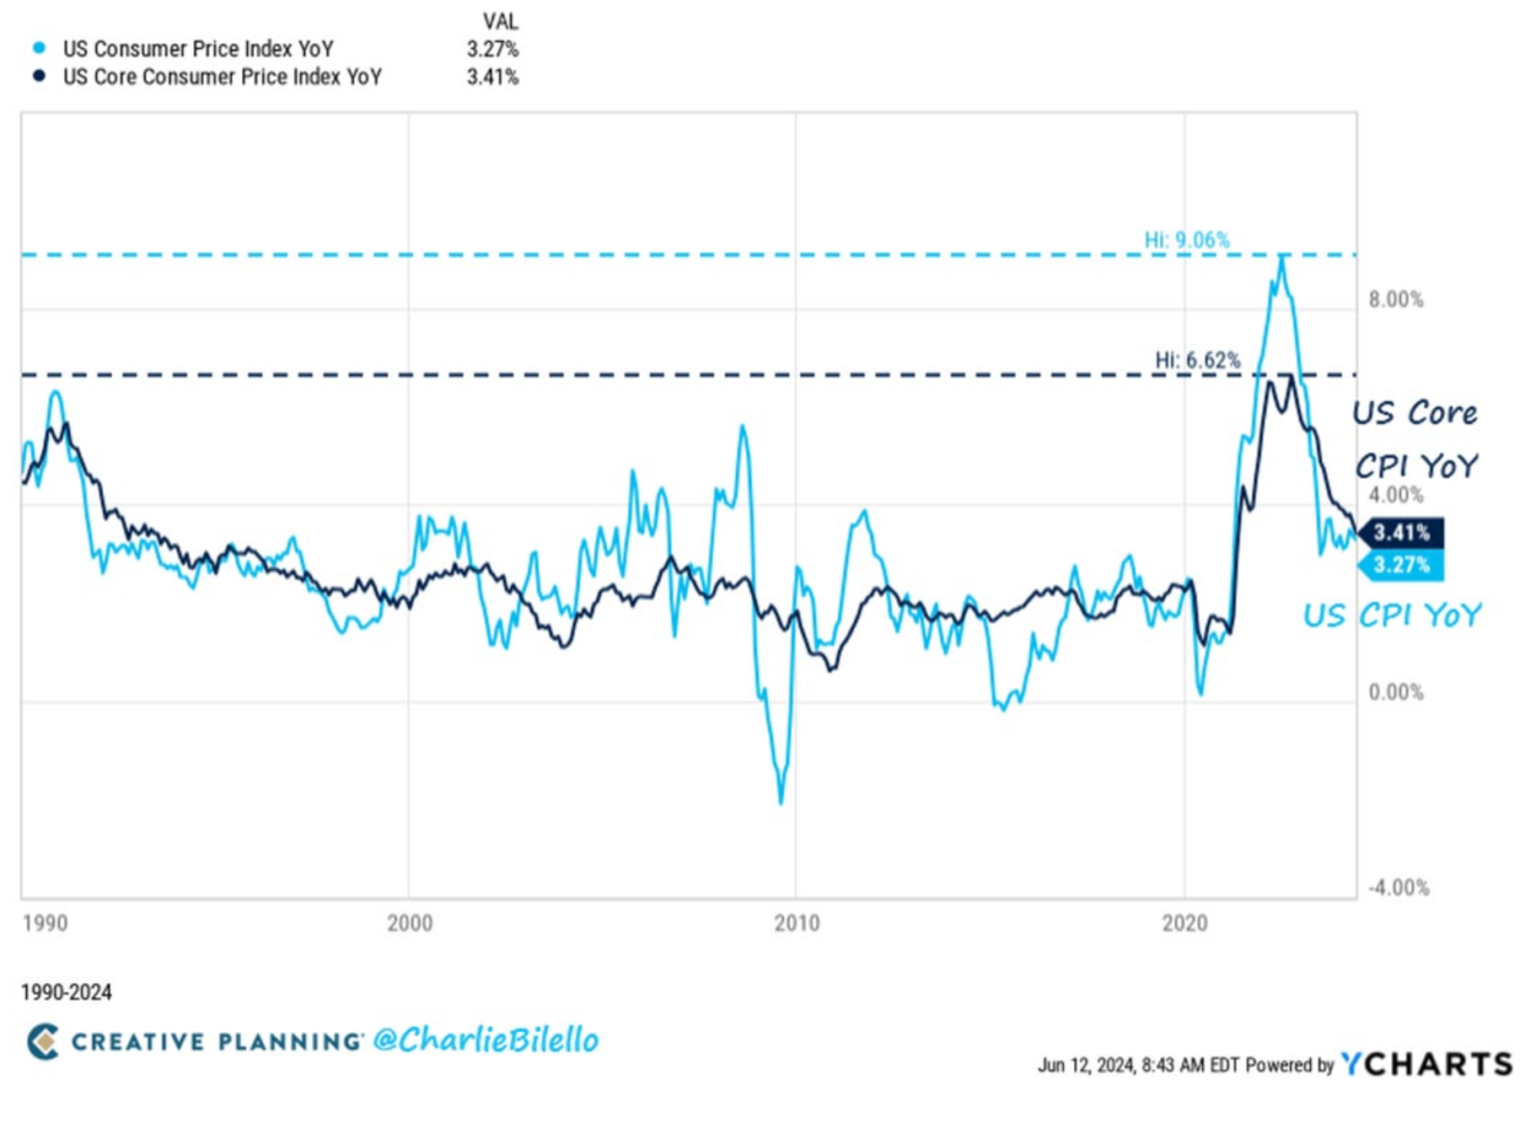
Economic indicators were mixed and open to interpretation this quarter. Real Gross Domestic Product (GDP) growth of 1.4% in the first quarter marked another quarter of economic expansion despite restrictive monetary policy, but this growth was both lower than the fourth quarter (3.4%) and analyst expectations (2.9%). The core Consumer Price Index (CPI) for May was up 3.4%, the smallest year-over-year gain in over three years and below consensus expectations. On the other hand, while the rate of inflation is lower, cumulative inflation for most categories over the last four years is significantly higher than wage growth: U.S. wages +17.1%, CPI food at home +20.5%, CPI shelter +22.6%, CPI food away from home +25.8%, CPI electricity +31.6%, CPI transportation +45.6%. Other measures of U.S. consumer health were generally positive. Consumer spending grew, consumer confidence was strong, household wealth and average hourly earnings continued to rise, and 4.0% unemployment remains well below the long-term average of 5.7%. Conversely, inflation-adjusted consumer spending was negative, unemployment is at the highest level since January 2022, GDP growth is moderating faster than expected, and household debt continues to climb ($4.9 trillion) with rising delinquency rates. Fed Chairman Jerome Powell summarized the state of the U.S. consumer well, “You’ve still got a household sector that’s in pretty good shape, but nonetheless, it’s not in the kind of shape it was a year or two ago.“
The Fed has made steady progress on reducing inflation, with core Personal Consumption Expenditures (PCE), its preferred measure for inflation, falling to 2.6% in May after stalling at 2.8% for the prior three months. This is down from 4.7% a year ago. Despite the considerable progress made over the last year, the rate of decline in 2024 has moderated, leading the Fed to adjust their interest rate expectations downward to a single federal funds rate cut this year. The market is now pricing in one to two rate cuts in 2024 (more optimistic than the Fed forecast), down from three cuts last quarter and six to seven at the beginning of the year.
We think the Fed’s data-driven approach to rate setting and expectations management has been successful thus far as it attempts to steer the economy to a rare “soft landing” (slowing economic growth to reduce inflation to its 2% target without triggering a recession). The equity markets have increasingly priced in the probability of this outcome, driving the S&P to new highs. However, a soft landing is not guaranteed, and rates could stay higher for longer than the market expects. As such, we remain disciplined in our risk management approach, positioning portfolios to capture upside in a soft-landing scenario while minimizing downside risk.
Equities
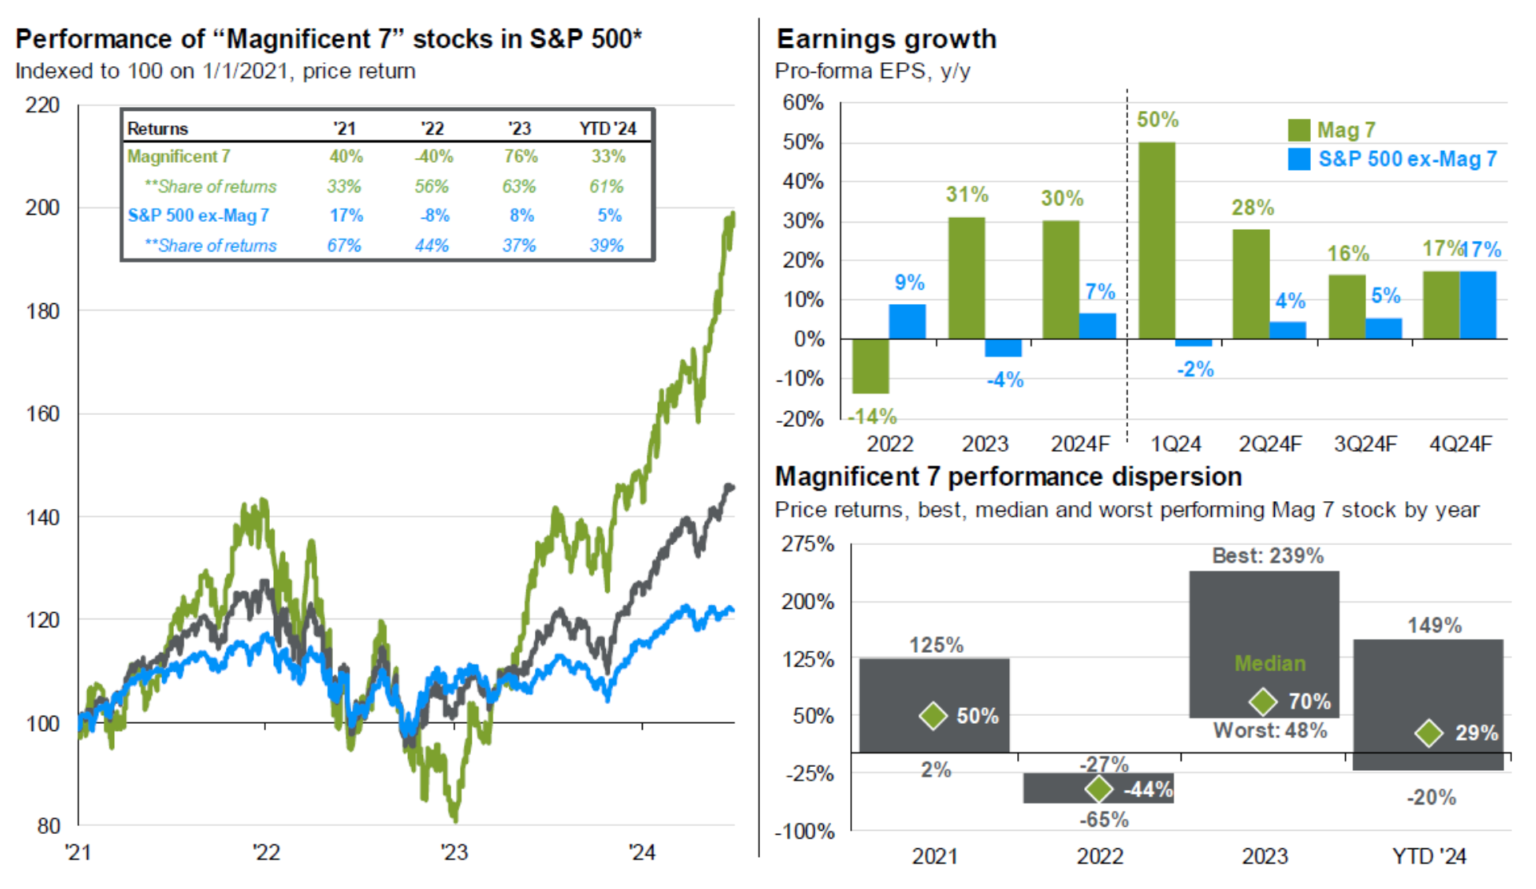
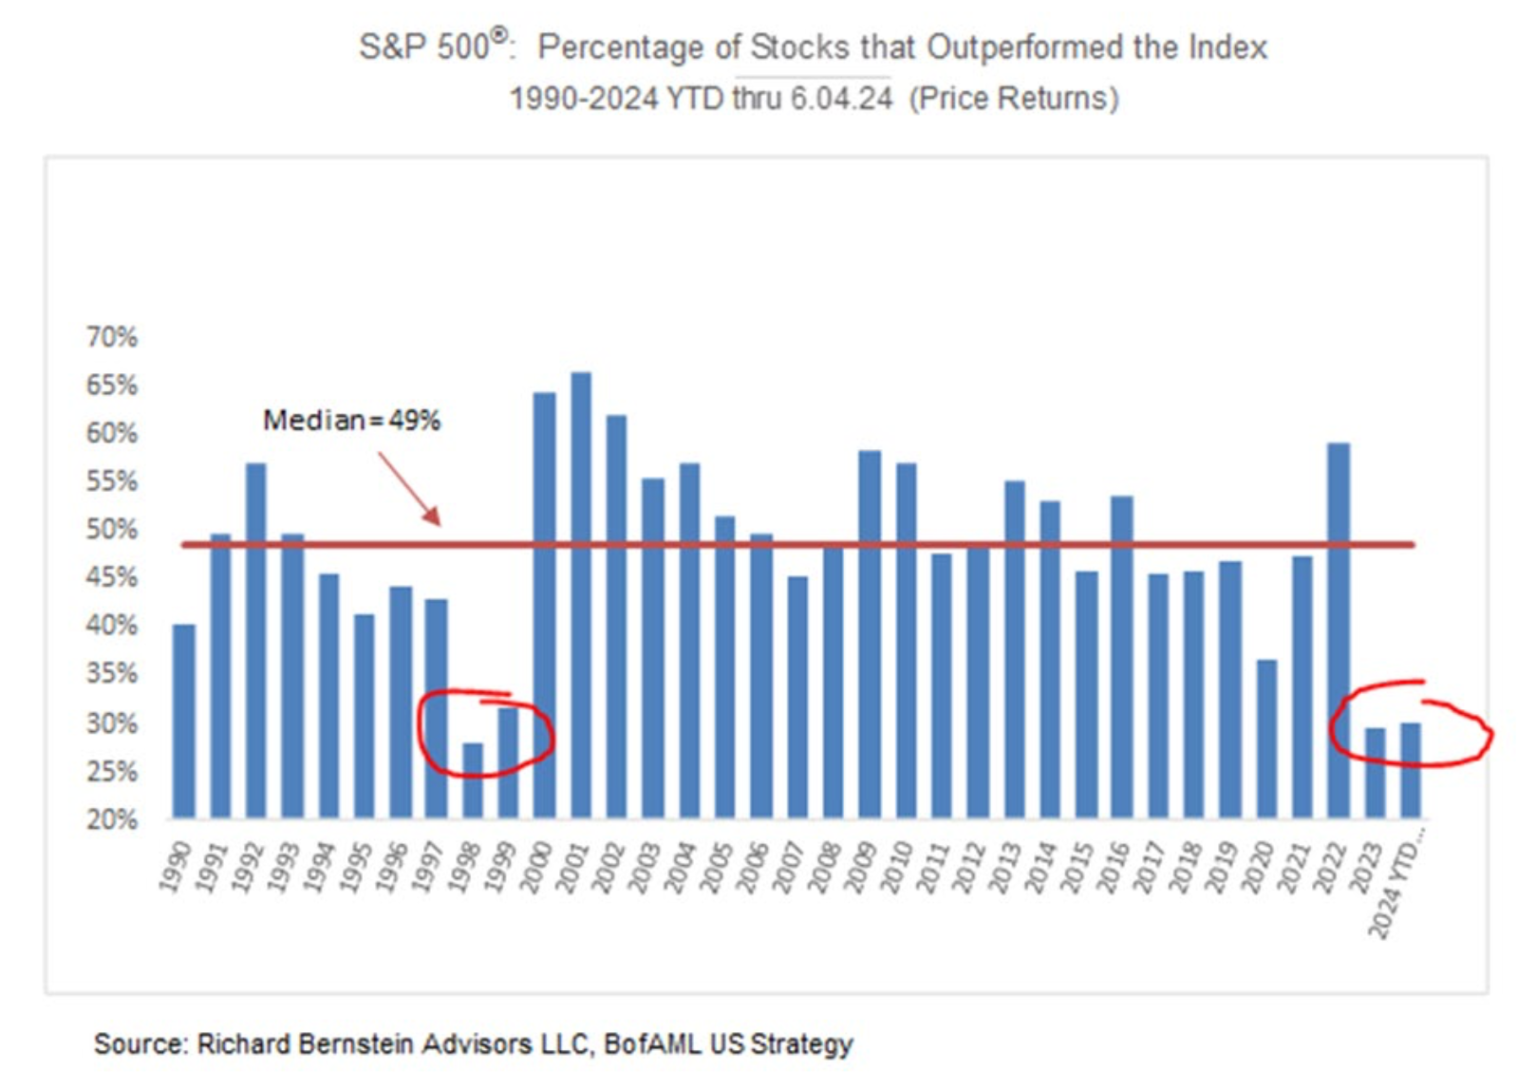
Headline returns for the S&P 500 index (SPX) were strong in the quarter, but after drilling down, these returns were driven by significant levels of concentration in the index. The SPX is a market capitalization-weighted index where gains in the largest companies’ share prices disproportionately affect its return. Three companies (Nvidia, Apple, and Microsoft) represent over 20.0% of the SPX. This level of concentration is historically significant: the last two technology-led market peaks had concentration levels of 13.7% (2020: Apple, Microsoft, Amazon) and 12.0% (1999: Microsoft, General Electric, Cisco). Market breadth (a measure of how many companies in the index are contributing to gains) is also the narrowest since 1999-2000 with only 25% of constituents outperforming the index year-to-date. Nvidia alone has accounted for nearly one-third of the SPX’s gains this year with its P/E multiple increasing from 25x to 40x its one-year forward earnings estimate, and its market capitalization is now over 5x the current estimate for 2025 total global chip sales.
The Equal Weight S&P 500 index (SPW) calculates the returns of the index constituents differently, averaging the returns of each company, allowing each to contribute equally to performance. This methodology normalizes the distortion caused by the current elevated concentration levels in the SPX. The SPW performance will now be available for reference in our regular reporting to complement the SPX beginning this quarter. The second quarter and year-to-date returns for the SPW were down -2.6% and up 5.1%, respectively.
The divergence in returns of the two indices raises the question of whether diversification as a strategy is still effective. Should investors abandon risk management, own the largest tech companies at or above their index weights, and chase returns? While this approach has “worked” recently, Guyasuta’s strategy of building diversified portfolios of reasonably priced companies with above GDP growth rates can compound value at highly attractive rates over the long term. We do this with capital preservation in mind, managing risk by owning high-quality companies, and sizing them and their sector weightings appropriately to avoid situations where individual stocks/industries could generate permanent capital losses at the portfolio level. While owning a concentrated portfolio of technology companies may seem compelling based on recent returns, the market is forward-looking in nature and is pricing these assets at valuations assuming these businesses can grow at or above recent growth rates over the long-term. Our experience tells us that while these are high-quality businesses and some of the most obvious winners in AI, they are fully valued and carry significant downside risks if growth rates do not meet the market’s ever-growing expectations.
Since 1983, we have constructed portfolios of high-quality businesses with strong balance sheets, solid free cash flow generation, and competitive moats at reasonable valuations, that can outperform in the long run while providing a margin of safety and downside protection. There will be stretches where different strategies may outperform, but we have conviction that our approach will continue to generate attractive results over full market cycles. We will continue to seek opportunities in other areas of the market that benefit from secular tailwinds that are trading at more reasonable levels.
Fixed Income
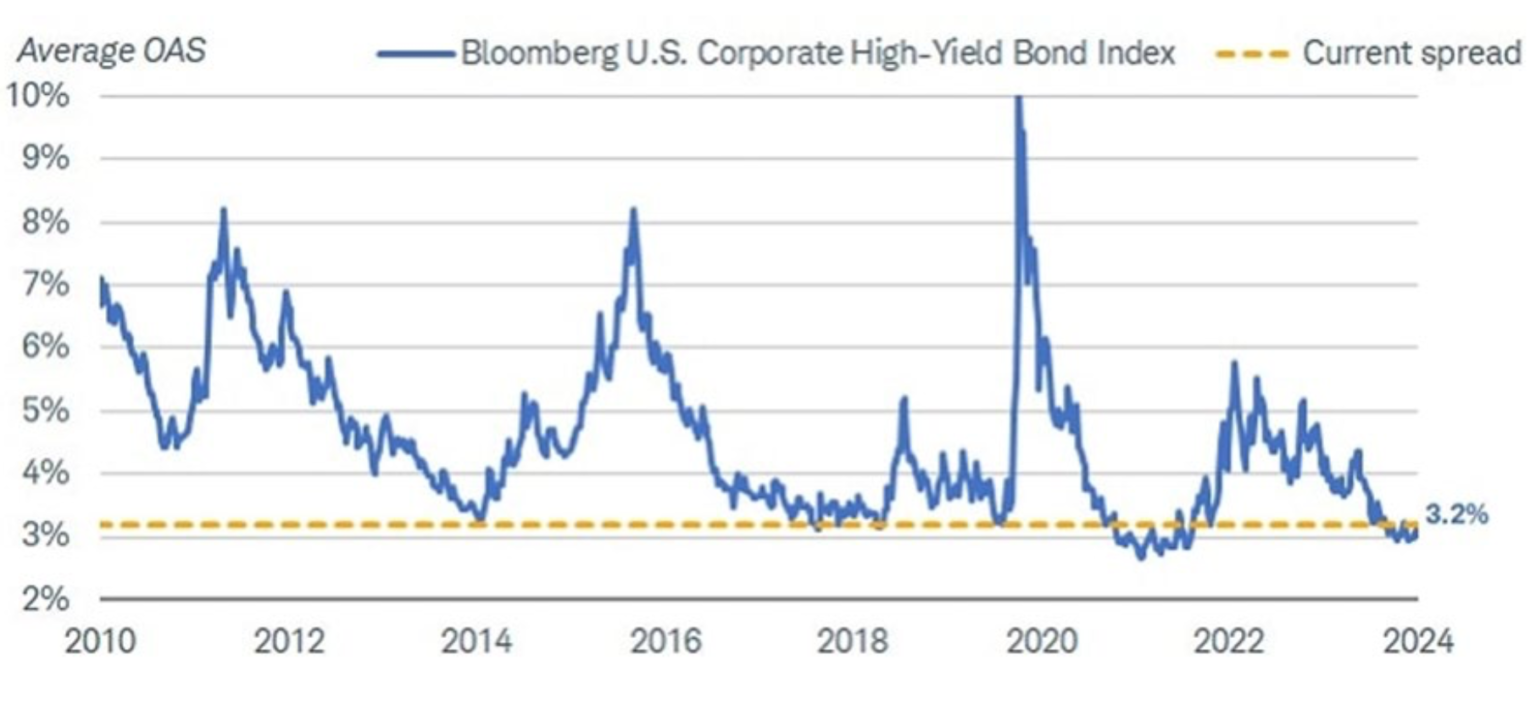
After a selloff at the start of the second quarter that saw the 10-Year Treasury yield climb from 4.2% to 4.7% at the end of April (prices down/yields up), bonds rallied with 10-Year Treasuries ending the quarter at 4.4%. At the short end, rates are 10bps higher from the start of the quarter, mainly due to investors recalibrating expectations of the Fed cutting interest rates three times to once or twice. Credit markets during the quarter have not been immune to the stretched valuations in the equity markets, illustrated by multi-year tight credit spreads.
In fact, spreads have become so tight that high-yield investors have begun purchasing investment grade bonds because BB and BBB credits are trading nearly on top of each other (+67bps). Typically, higher risk (high yield, BB) bonds offer a greater yield than their lower risk (investment grade, BBB) alternatives to compensate investors for the increased risk. Since 2000, this spread has averaged 164bps.
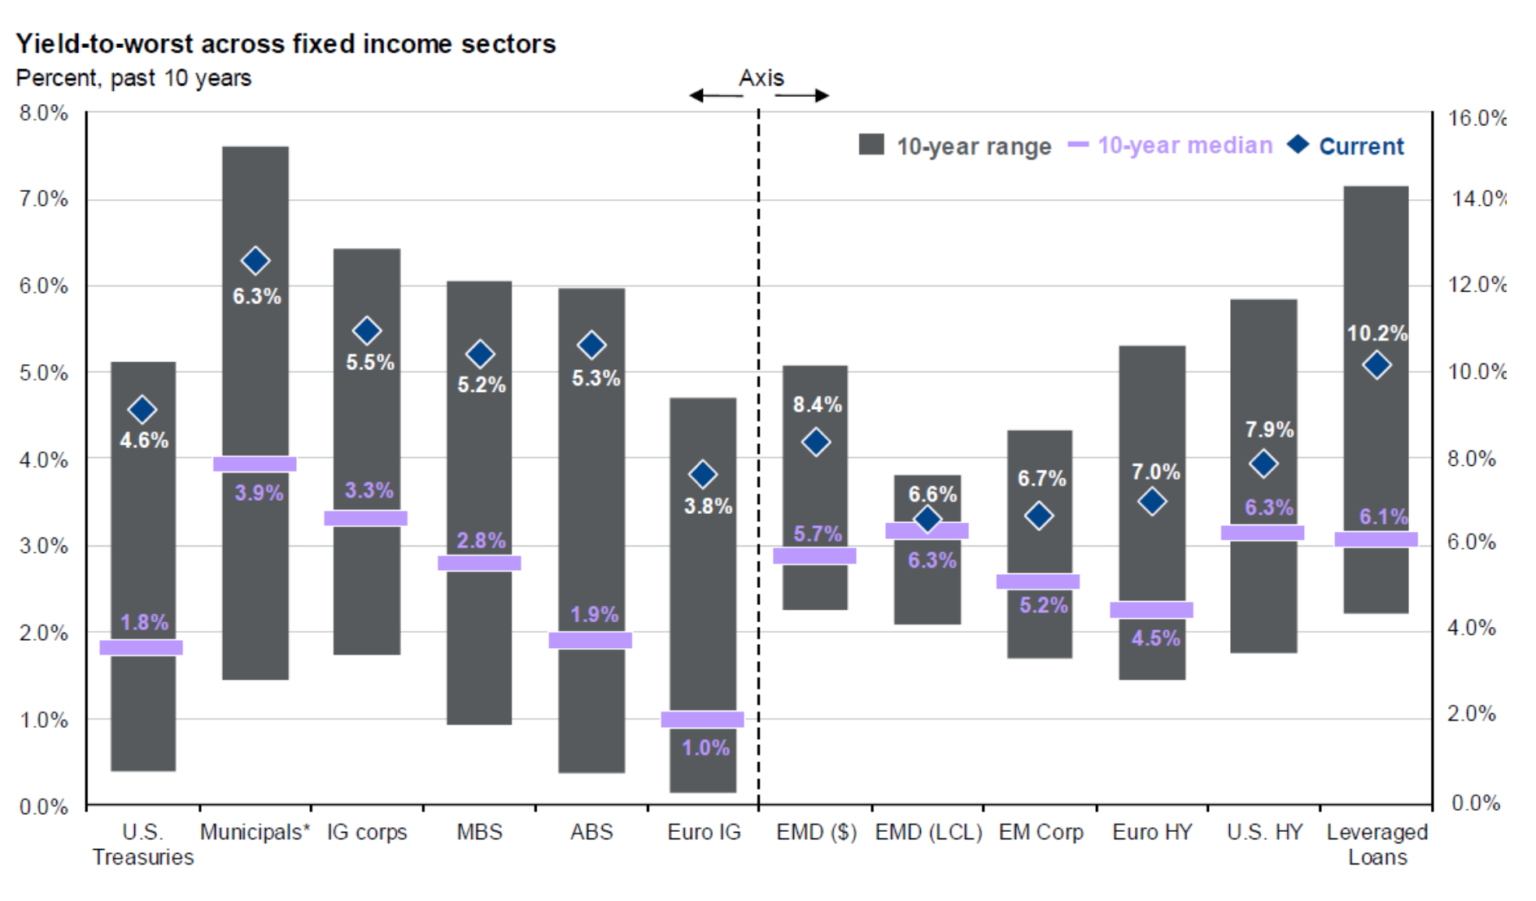
On an absolute basis, yields on investment grade credit are above 5%, offering investors 2+% real returns on high quality credit. Therefore, investor demand has remained strong for any paper with a positive spread to treasuries despite tight spreads. This strong demand from fixed income investors has led to the second most active six months of investment grade issuance since 2020. As we discussed in last quarter’s comments, the inverted yield curve and the tight spreads have served as a shadow rate cut for businesses, easing concerns about a 2025-26 maturity wall.
In the municipal market, year-to-date issuance has picked up ~40% relative to 2023 as the reality of “higher for longer” interest rates and the need to finance new municipal infrastructure has brought issuers off the sidelines. Investor appetite has been robust. While municipal valuations appear full, on an absolute basis, high tax bracket investors can lock in taxable equivalent yields north of 5% on these high-quality credits.
The government has also been active in issuing $243 billion of treasuries across the curve during the quarter. While we have not seen any signs of crowding out or satiation of demand for treasuries or credit, this appetite seems to hinge on investors’ assumption that the Fed will cut rates at least once if not twice before year end. If Powell and company do not come through with a rate cut in the fall, we could see a repricing of both treasuries and credit.
Fixed income continues to be an attractive option for income-focused investors provided that inflation ultimately settles near the Fed’s stated 2% target. Furthermore, higher interest rates have brought the diversification benefits of bonds back into play in the event of an economic downturn. We have added across the maturity spectrum, maintaining laddered bond portfolios with final maturities of approximately 10-12 years and overall duration of 5-6 years, though individual portfolios can be tailored to meet specific objectives. This strategy allows investors to capture currently available yields while being reasonably well hedged against interest rate risk. If rates move higher from here, bonds maturing in the near term can be reinvested at higher rates. Conversely, if rates come down and the yield curve assumes a more normal upward slope, investors have locked in attractive yields on high quality credits.
Summary
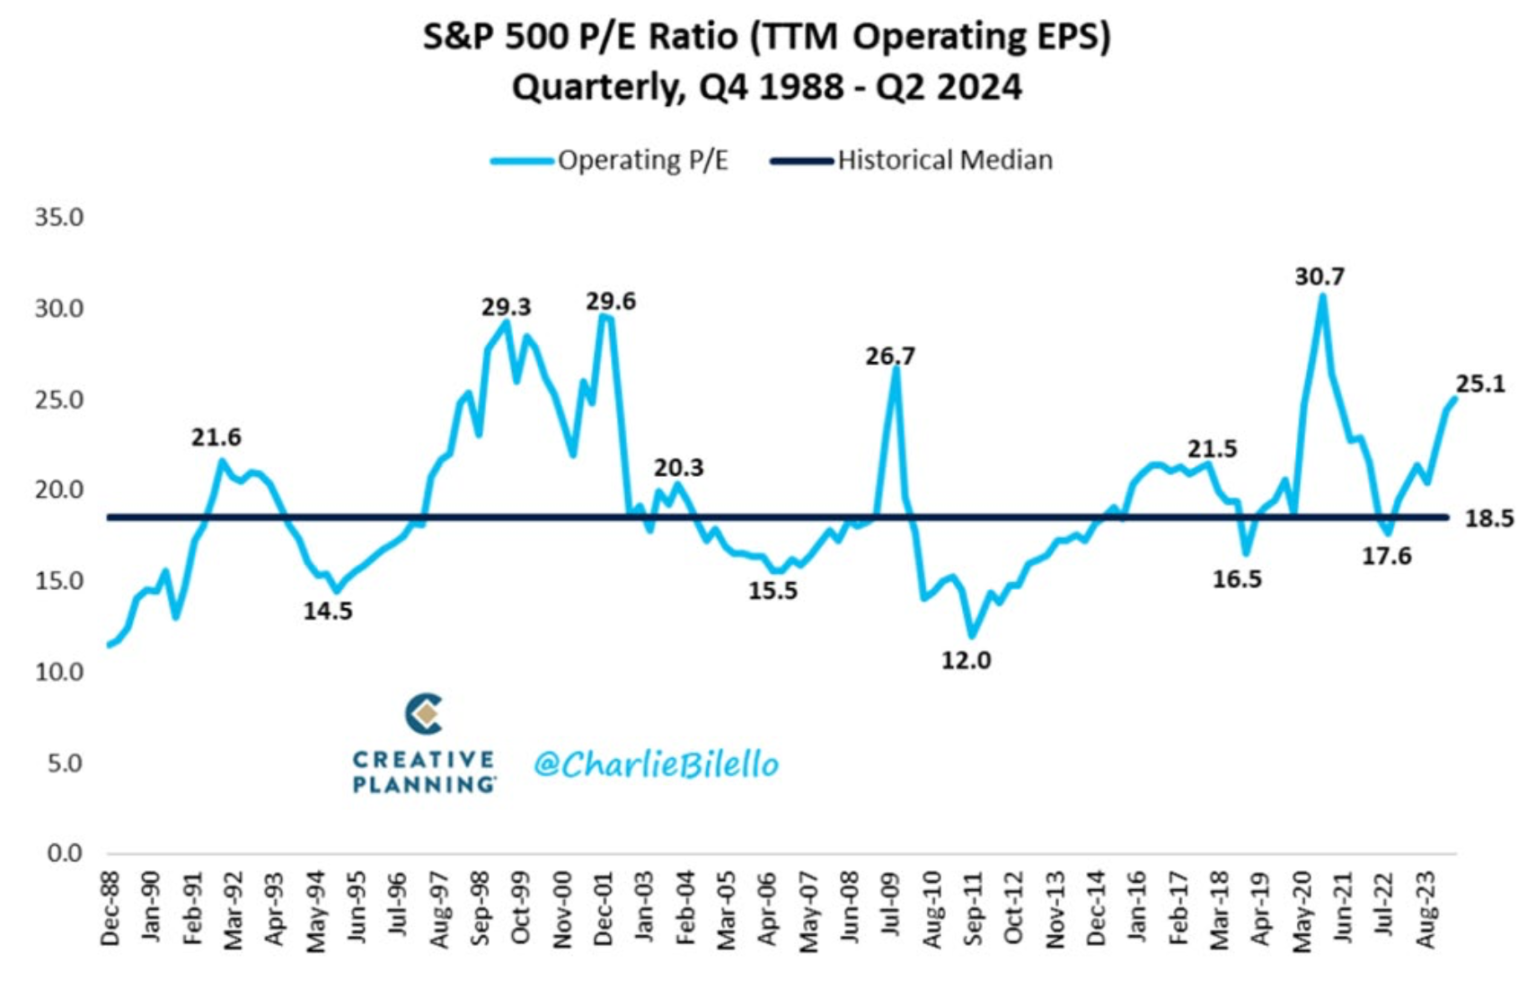
The SPX and SPW were up 4.3% and down -2.6% in the second quarter of 2024. The uncertainty surrounding a potential soft landing has prompted investors to concentrate on the largest technology companies with the clearest exposure to the AI theme. This shift has caused the divergence of returns in the two indices. The SPX trades at 21.3x this year’s earnings estimate, expanding 3.4% from last quarter despite positive earnings estimate adjustments. The SPW trades at a more reasonable 15.9x, down from 17.0x in the first quarter. The economy continues to march forward at a slower rate as the Fed tries to deliver a soft landing. Tight credit spreads imply debt markets are not foreseeing future economic stress, while the yield curve has been inverted for a record 600+ days, which is typically an indicator of a looming recession. In this uncertain climate, our time-tested research process for equities and fixed income is unchanged. We aim to identify high-quality companies and credits that offer attractive return potential and provide a margin of safety that protects the downside.
Interesting divergence of GDP forecasts: Federal Reserve vs. Blue Chip survey
Core inflation hitting its lowest level since April 2021
The Magnificent 7 performance and earnings dynamic
Weak market breadth
S&P 500 P/E ratio is the highest since 1st quarter 2021
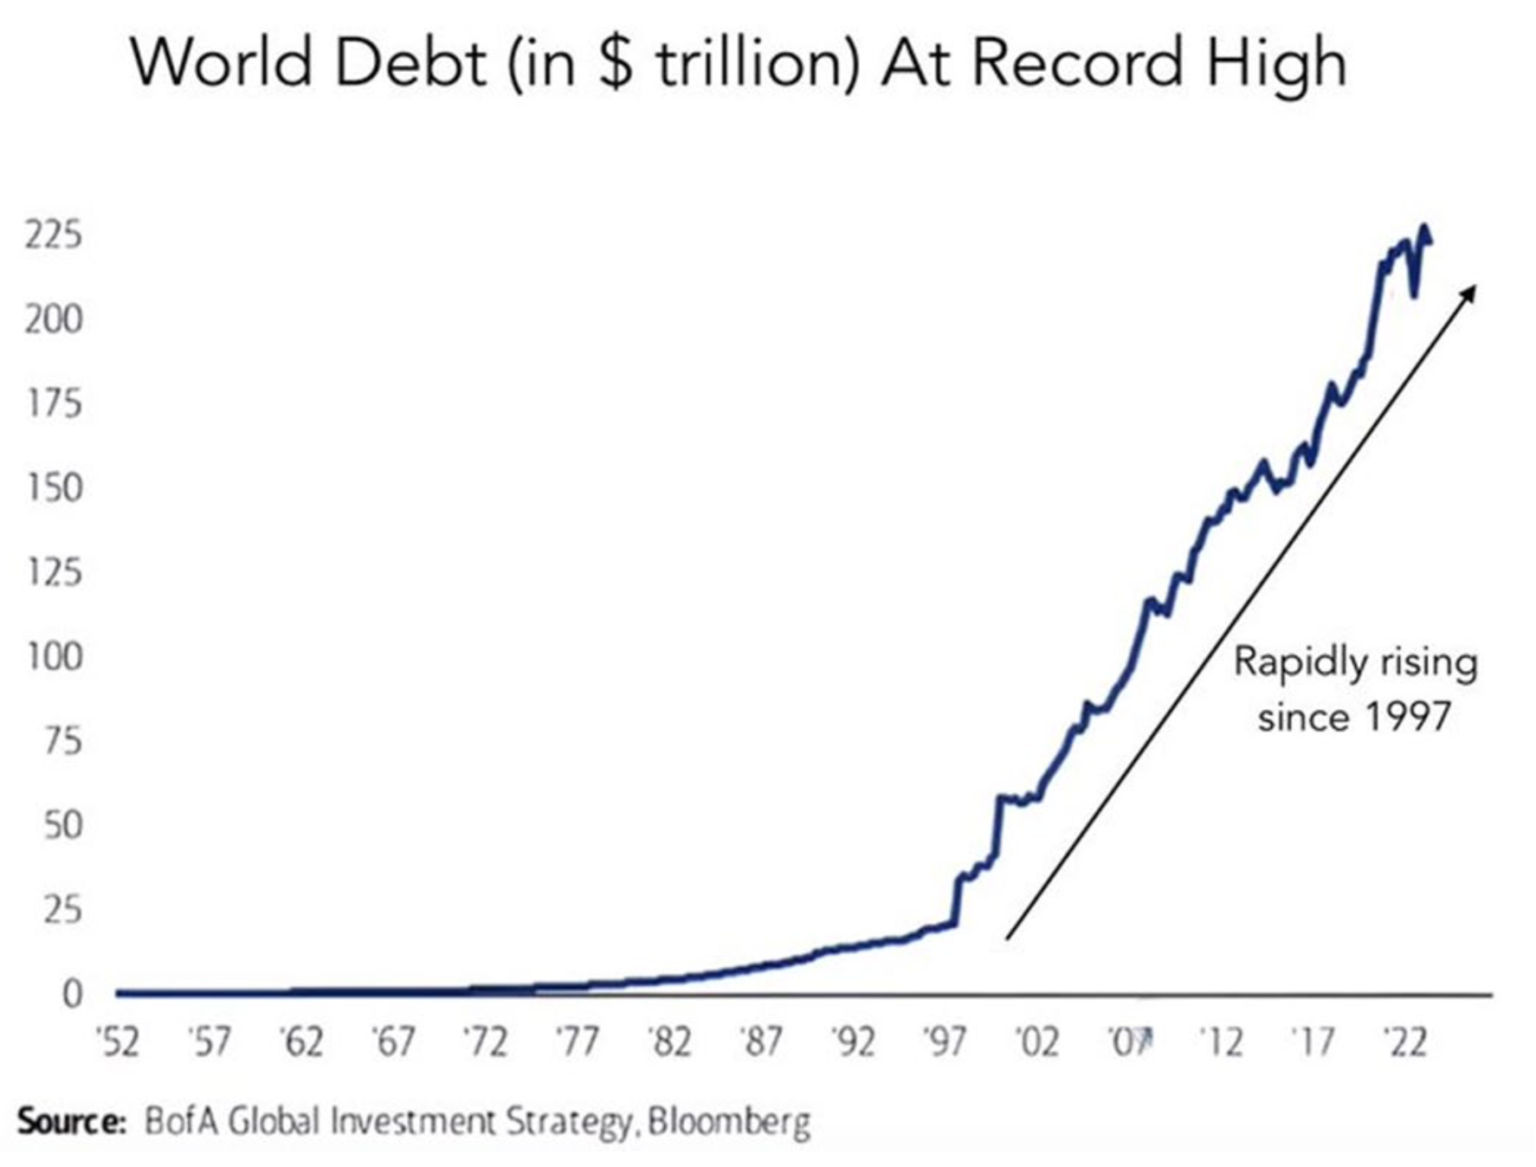
World debt: Potentially a future financial crisis
Fixed-income valuations
High-yield bond spreads are low